


Fintech entrepreneurs’ guide to creating enterprise value starts with contribution profit
No two fintech companies measure gross profit the same way. For a more reliable measure of profitability, we suggest entrepreneurs understand the true variable costs to their business—and build towards contribution profit instead.

Gross margin is a well understood GAAP metric for software-as-a-service (SaaS) companies—it acts as the limit to the ultimate profitability of your business and has an outsized impact on valuation. The difference between revenue and cost of goods sold (COGS), gross margin facilitated the advent of the SaaS model which has few direct costs outside of licenses and hosting expenses.
But even the SaaS model has other, sometimes less obvious, variable expenses, like onboarding costs, customer support, and sales engineering. Unlike enterprise SaaS, fintech has dozens of fundamentally different business models, and while gross profit in theory should cross all of them, not all gross margin is created equal. In fintech, variable costs can range from interchange processing fees (payments) to clearing costs (investments) and origination and servicing costs (lending)—and most of fintech’s variable expenses don’t scale linearly with revenue or transaction volume.
Still, fintech investors continue to rely on gross profit multiples for company valuations, so it’s important for early-stage founders to learn how to articulate the variable delivery of their products. Given the dozens of different business models in fintech, it’s time for a sharper understanding of gross profit in the industry.
In this article, we attempt to “normalize” gross profit by replacing it with our definition of “contribution profit.” In an effort to simplify and compare, we broke down the business models and margin structures across seven different fintech categories, explaining how entrepreneurs might think about contribution profit in each one. While there are still many variations even within a single category (and some excluded), this guide illustrates how to think about the margin profile of your business and strategize accordingly.
Variable expenses and contribution profit across fintech business models
Why gross margin varies in fintech
Despite its intended purpose, gross margin in fintech is rarely clear cut or standard. We often see variable costs categorized in different places in fintechs’ P&Ls, which might obscure the true cost of incremental delivery of a fintech product.
To illustrate how it can be hard to compare apples-to-apples:
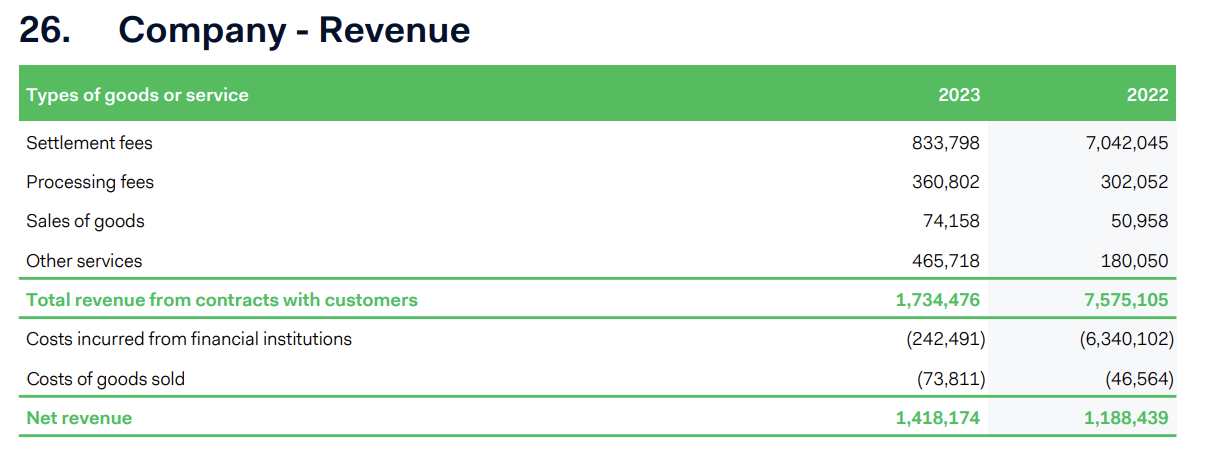
- Toast recognizes its payment transaction fees from financial technology solutions revenue (87% of total revenue) as revenue on a gross basis, according to securities filings. Therefore, Toast measures metrics like gross margin and EBITDA margin with a gross revenue denominator. (Figure 1)
- Adyen, on the other hand, measures its revenue on a net basis, after costs incurred from financial institutions and other COGS. Therefore Adyen’s EBITDA margin, which was 46% in 2023, uses a net revenue denominator. (Figure 2)
- Meanwhile, in insurance, Hippo doesn’t report gross profit at all, while Lemonade measures it against its net earned premium. Lemonade also adjusts its gross profits to take into account employee expenses associated with underwriting operations.
Figure 1: Toast 2023 10-K

Figure 2: Adyen 2023 10-K
It can be challenging to take gross margin at face value, particularly for more complex business models with more variable costs, like in fintech. Rather than anchor against reported gross margin, we encourage founders and operators to anchor against true contribution profit or in consumer businesses, contribution profit after marketing expenses. In other words, the revenue that is left after all variable expenses have been accounted for. This helps understand the true profitability of a product at a unit level, and can help inform a business on where to invest and how to scale towards overall business-level profitability.
Contribution profit can be more of an art than a science. It typically requires partial allocation of headcount expense, which can require discretion as many employees span both variable and fixed operations.
The obvious question then becomes, what should my contribution profit be? This question is particularly challenging because of how subjective the KPI can be and how few public companies report it. From our experience talking to thousands of fintech companies, we’ve seen a wide range of contribution profit, particularly based on the maturity of the business. What is likely more instructive is to think about how contribution profit scales for a fintech business. This is especially relevant for early stage businesses.
Many of the variable costs of fintech companies do not scale linearly with revenue or volume / transactions. For example, a fintech might set up an entire compliance team and program management function to handle their card programs. These are upfront costs such that the headcount doesn’t have a one-to-one correlation to the scale of the card programs. The same can be said for an underwriting or claims team for an insurer relative to the gross written premium.
Similarly, many fintechs’ contribution profit margins are highly dependent on negotiated take-rates, interest, or revenue share with partners that, with scale, will become more favorable with volume. For example, an early-stage credit fintech might start with an expensive private credit facility, eventually graduate to a cheaper bank facility, and then ultimately utilize a forward flow model. Each of these stages of the business would have notably different contribution profit margins based on cost of capital. Similarly, an insurance MGA might begin ceding almost all of its risk to a reinsurer and fronting carrier with claims handled by a TPA; as it scales it might bring these in-house and have an entirely different contribution profit margin profile.
SoFi’s lending business’s contribution profit over time is a perfect example of this.
Figure 3: SoFi Lending Segment Contribution Profit Over Time
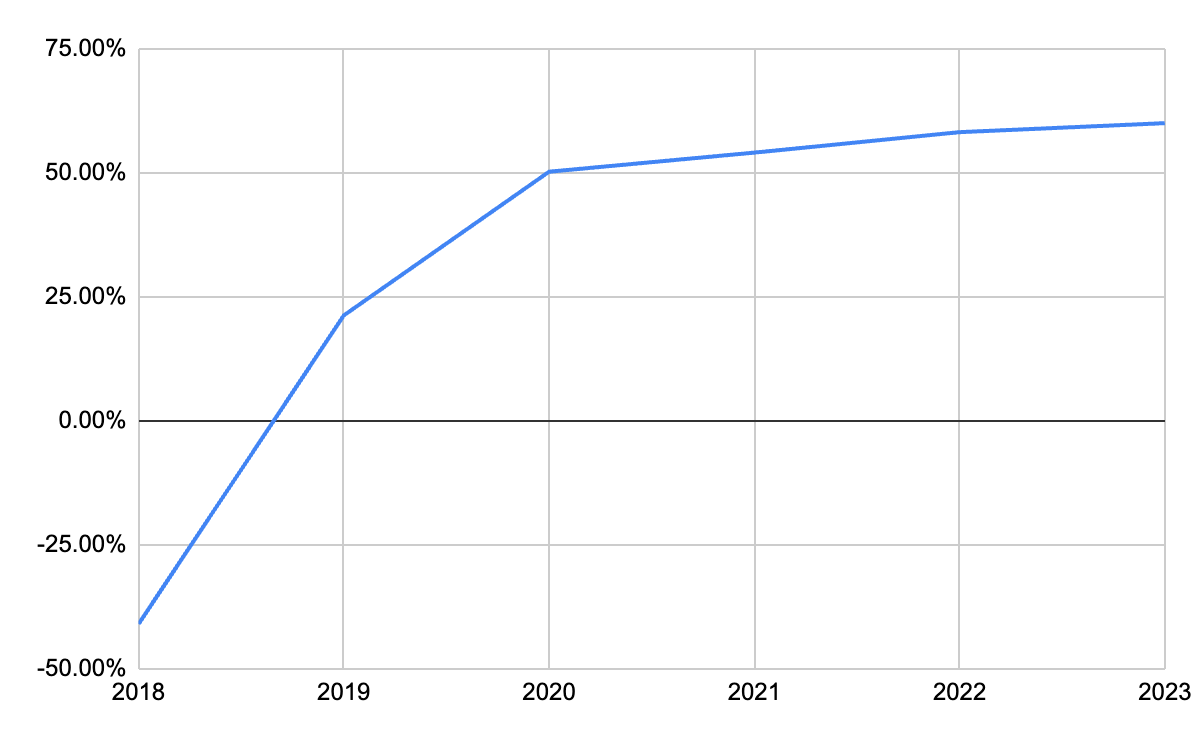
Contribution profit is a moving target for fintechs, but is critical in understanding the leverage in your business. Fintech businesses often have a litany of variable costs that are sometimes not obviously variable. Even if these cost structures change, it is important to model out what the long-term unit economics look like as fintechs push towards ultimate profitability.
Action steps for founders
To get clear on contribution profit and best position your unique business model for success, we encourage founders to follow these five steps:
- Map your variable expenses: Take the time to thoroughly map out all your variable expenses, even those that don't traditionally fall into COGS.
- Calculate your true contribution profit: Use our definition in this guide to calculate the contribution profit for each of your product lines.
- Model your scaling economics: Create models that show how your contribution profit might change as you scale. Consider factors like improved partner rates, operational efficiencies, and spreading fixed costs.
- Use contribution profit to guide decisions: When deciding where to invest or which products to focus on, look at contribution profit rather than just revenue or gross margin.
- Educate your team and investors: Make sure your team and investors understand why contribution profit is a more meaningful metric for your business than traditional gross margin.
Real-world example: SoFi
Let's look at how this plays out in the real world. SoFi, a public fintech company, provides a great example of how contribution profit can vary across different business lines—from 60% for its lending business to -1% for its financial services segment in 2023.
While most public companies don’t break out contribution profit in their public filings (or often even gross margin), SoFi is an exception and a great case study for operators. Management breaks down direct expenses for each business segment at a granular level, including attributable headcount expense based on employee time spent on each segment. These expenses include sales and marketing, member incentives, product fulfillment expenses, and lead generation.
SoFI’s management team has boiled down the true cost to deliver an incremental dollar of revenue for each segment. This is the essence of what gross profit is supposed to convey, but in more complex business models often does not or gets lost. It is the fundamental unit economic question that says how many dollars out will be created from every additional dollar in.
Looking below at the overview by segment for SoFi, contribution profit varies from -1% to 60% for its three segments.
Figure 4: SoFi 2023 10-K, Segment Contribution Profit
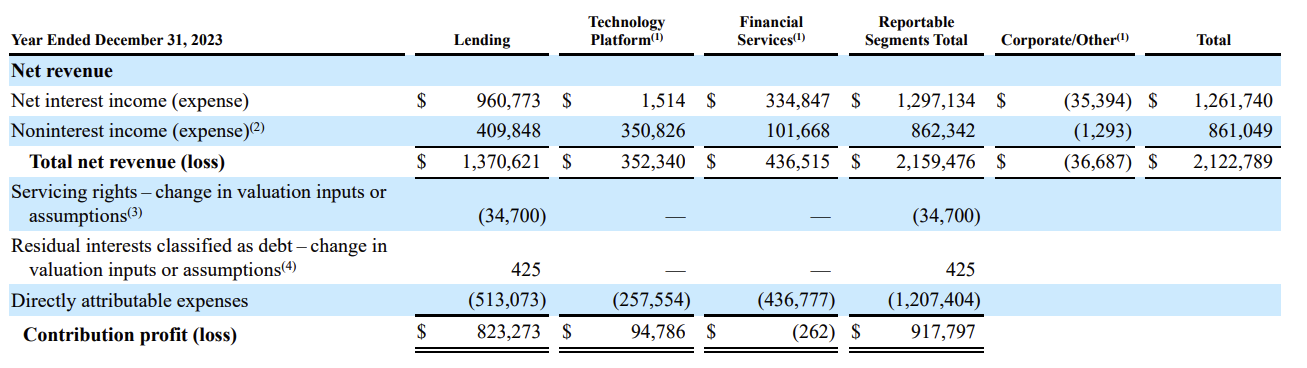
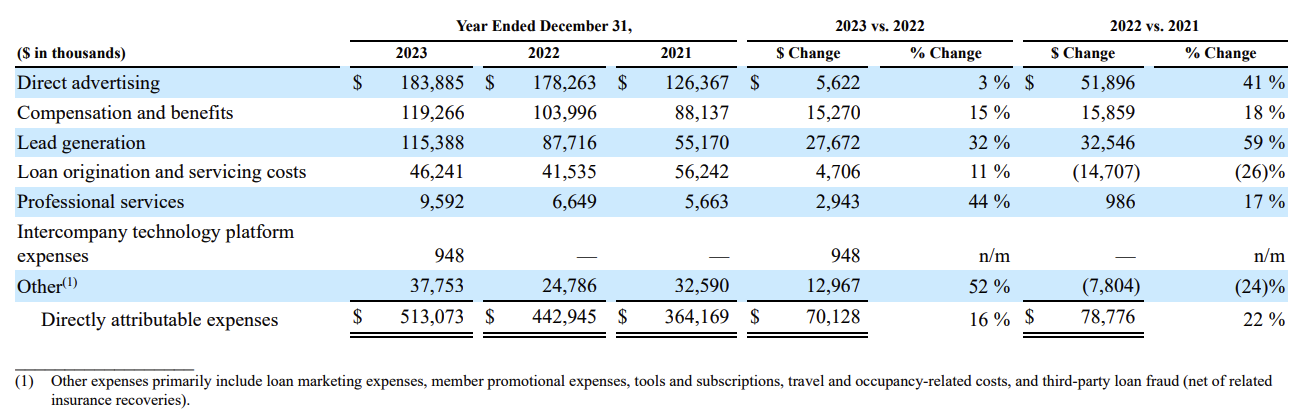
Breaking down each segment below, starting with lending. The primary variable costs are a variety of sales and marketing expenses, origination and servicing costs, professional services, shared services/technology, and fraud. These costs, even if not linearly, increase with each loan.
Figure 5: SoFi 2023 10-K, Lending Segment Directly Attributable Expenses
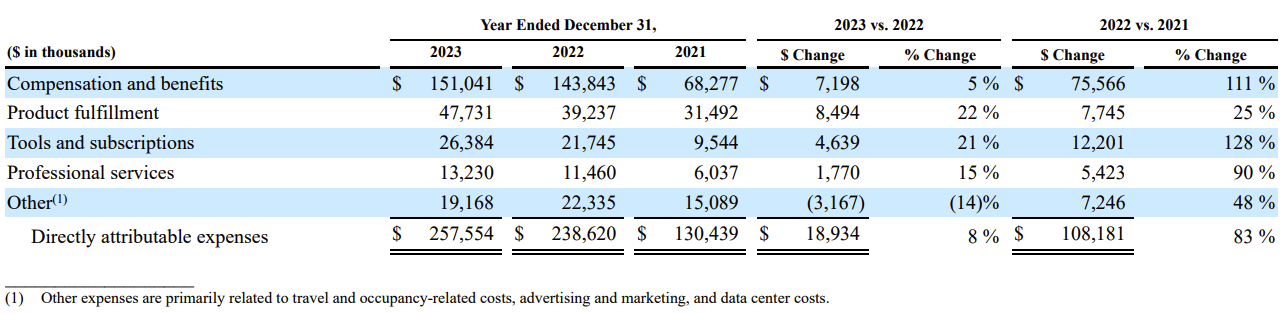
The technology platform segment, however, which includes its Galileo and Technisys platforms, looks more like a typical software business. Its direct costs are primarily the headcount and other expenses associated with onboarding and delivering the product. However, product fulfillment does include payment processing network fees, as this segment includes a core banking product that has integrated payment processing. This is another example of how even financial software margin might look different than a typical enterprise software platform.
Figure 6: SoFi 2023 10-K, Technology Platform Segment Directly Attributable Expenses
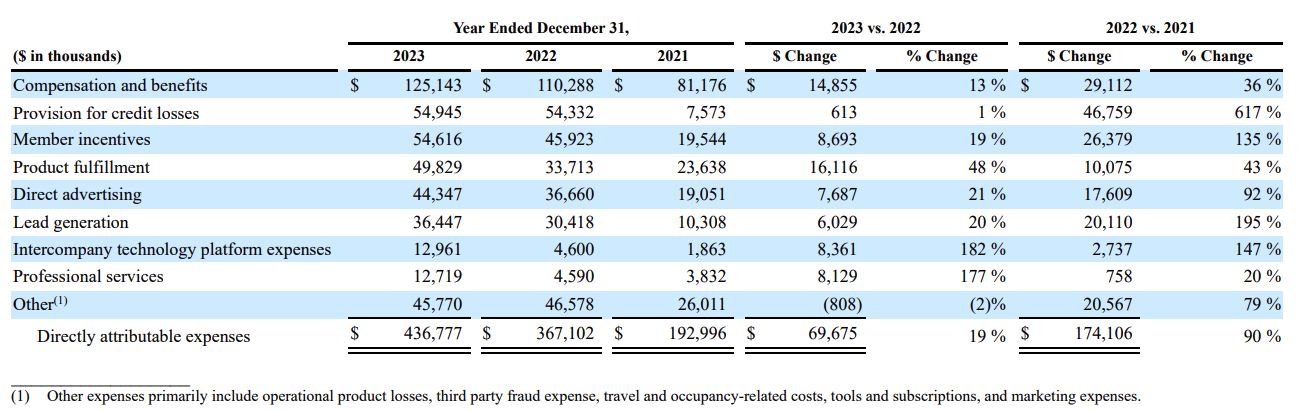
SoFi’s financial services segment aggregates a few different business models that we called out earlier: payments (SoFi Money), brokerage (SoFi Invest), credit (SoFi Credit), lead generation (Lantern Credit), insurance (SoFi Protect), and others. Therefore it is hard to boil down the variable expenses associated with any single one of these products.
Figure 7: SoFi 2023 10-K, Financial Services Segment Directly Attributable Expenses
See Less