Benchmarks for growing health tech businesses
After studying the performance of 50 top healthcare technology businesses, we reveal the fundamental trends and benchmarks leaders need to know about healthcare SaaS and tech-enabled services.
Over the past decade, there has been little quantitative insight into understanding what ‘typical’ or ‘best in class’ looks like when building and scaling digital health businesses. As a category, health tech first took off around 2010 thanks to the Health Information Technology for Economic and Clinical Health Act (HITECH Act) and the Patient Protection and Affordable Care Act (PPACA). Today, there is finally a large enough basket of companies to analyze in order to understand how successful digital health predecessors have grown from $0 to $100 million and more in revenue.
Accelerated by a global pandemic, approximately 50 digital health companies have gone public through IPO or SPACd since 2019, more than 75 digital health companies have been minted unicorns, and many others have raised large late-stage growth rounds. Despite this activity, private market financial metrics are difficult to come by and only few have access to this information.
The Bessemer Healthcare team is taking a page out of the book of the Bessemer Cloud team, which has led benchmarking for SaaS businesses through Cloud 100 and Scaling to $100M for over two decades. In early 2020, we started by codifying our 10 Laws of Healthcare, and now with our research on building successful health tech businesses, we reveal the fundamental trends and benchmarks founders and leaders need to know to quantify the performance of building a health tech business. (Subscribe here to be the first to get our next piece on scaling health tech companies.)
We share these insights with the caveat that assessing healthcare companies may be more complex and nuanced than evaluating traditional SaaS business models. However, we hope that these benchmarks will be useful for every healthcare founder, CEO, CFO, and board member who wants to understand how predecessor healthcare businesses grew and what milestones they should strive to achieve.
At Bessemer, we’ve backed over five healthcare Centaurs ($100+ million in annual recurring revenue), and 75 other healthcare investments over the last 15 years. In order to derive insights from the health tech industry, we’ve assembled a database of 50 companies—compiling financial and operational metrics across business models to study how these businesses scale.
Building effective and efficient healthcare businesses is vital and a direct way to not only impact patient’s lives but also proliferate and improve the technology that evolves healthcare around the world. To deliver on a mission, health tech founders must focus on the business fundamentals and harness key performance indicators (KPIs) to drive efficient growth, and prove both the financial and clinical robustness and scalability of their model.
Anatomy of two business models
- Healthcare SaaS businesses are similar to Cloud B2B software companies. They sell cloud-based software alongside data and analytics. Top-line revenue is highly recurring, measured as contracted annual recurring revenue (CARR) and annual recurring revenue (ARR). The cost structure typically includes cost of goods sold (COGS) from hosting, implementation, and integration, as well as operating expenses for sales and marketing (S&M), research and development (R&D), and other general and administrative (G&A) expenses. The go-to-market motion varies depending on the stakeholder (payer, provider, pharma) and the size of the customer (enterprise, mid-size, SMB). Well-known examples of companies with Healthcare SaaS business models include Doximity ($DOCS), and Veeva ($VEEV).
- Tech-Enabled Services deliver care or navigation support to patients via either B2B2C or direct-to-consumer models. These businesses can range from hybrid care to fully-remote engagement with patients and can either be fee-for-service or fee-for-value (ranging from bundled services to recurring fee, shared savings, and capitation). Top-line revenue is transactional in nature but largely recurring as they treat chronic conditions and/or the buyer is the enterprise or consumer via subscriptions. The cost of goods sold (COGS) includes significant labor associated with clinical delivery, care navigation as well as technology hosting expenses. Operating expenses include sales and marketing (S&M) from both selling to customers (payers and employers if B2B) as well as acquiring and engaging patients, research and development (R&D), and other general and administrative (G&A) expenses. The go-to-market motion varies depending on the stakeholder (payer, provider, or patient). Well-known examples of companies with tech-enabled services as business models include Livongo (formerly $LGVO), and Accolade ($ACCD).
Of course, many businesses will not fit neatly into these business models. For example, companies in insurance, biotech platforms, therapeutics, diagnostics or medical devices are not included in this database and analysis.
While both cohorts of businesses are equally represented in this work, it’s worth noting that tech-enabled services are much more prevalent in the healthcare industry, representing approximately 70% of unicorns to-date and 80% of the public exits in the last five years. This is for good reason. Of the $4 trillion spent on healthcare in 2021, we estimate that three-quarters of that is the cost of delivering care and thus directly addressable by tech-enabled services businesses. A quarter of the total healthcare spend is attributed to administrative costs, of which today only about 10% is technology and software spend. While SaaS spend in healthcare is growing quickly, we are still in the early stages of digitization, leaving room for automation and reduction of administrative spend.
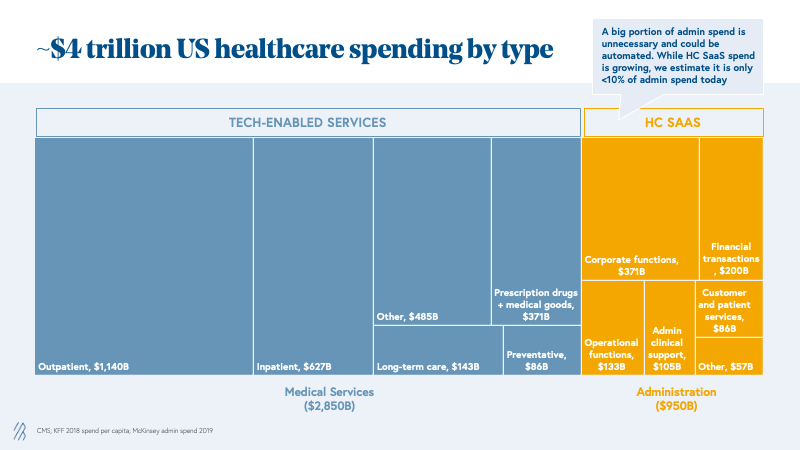
At Bessemer, we believe both business models—healthcare SaaS and tech-enabled services—are critical for the healthcare industry; companies that exhibit best-in-class KPIs are the ones that can serve their patients, providers, or practitioners and go on to building enduring legacies.
Initial lessons for building healthcare businesses
Insights on healthcare SaaS businesses
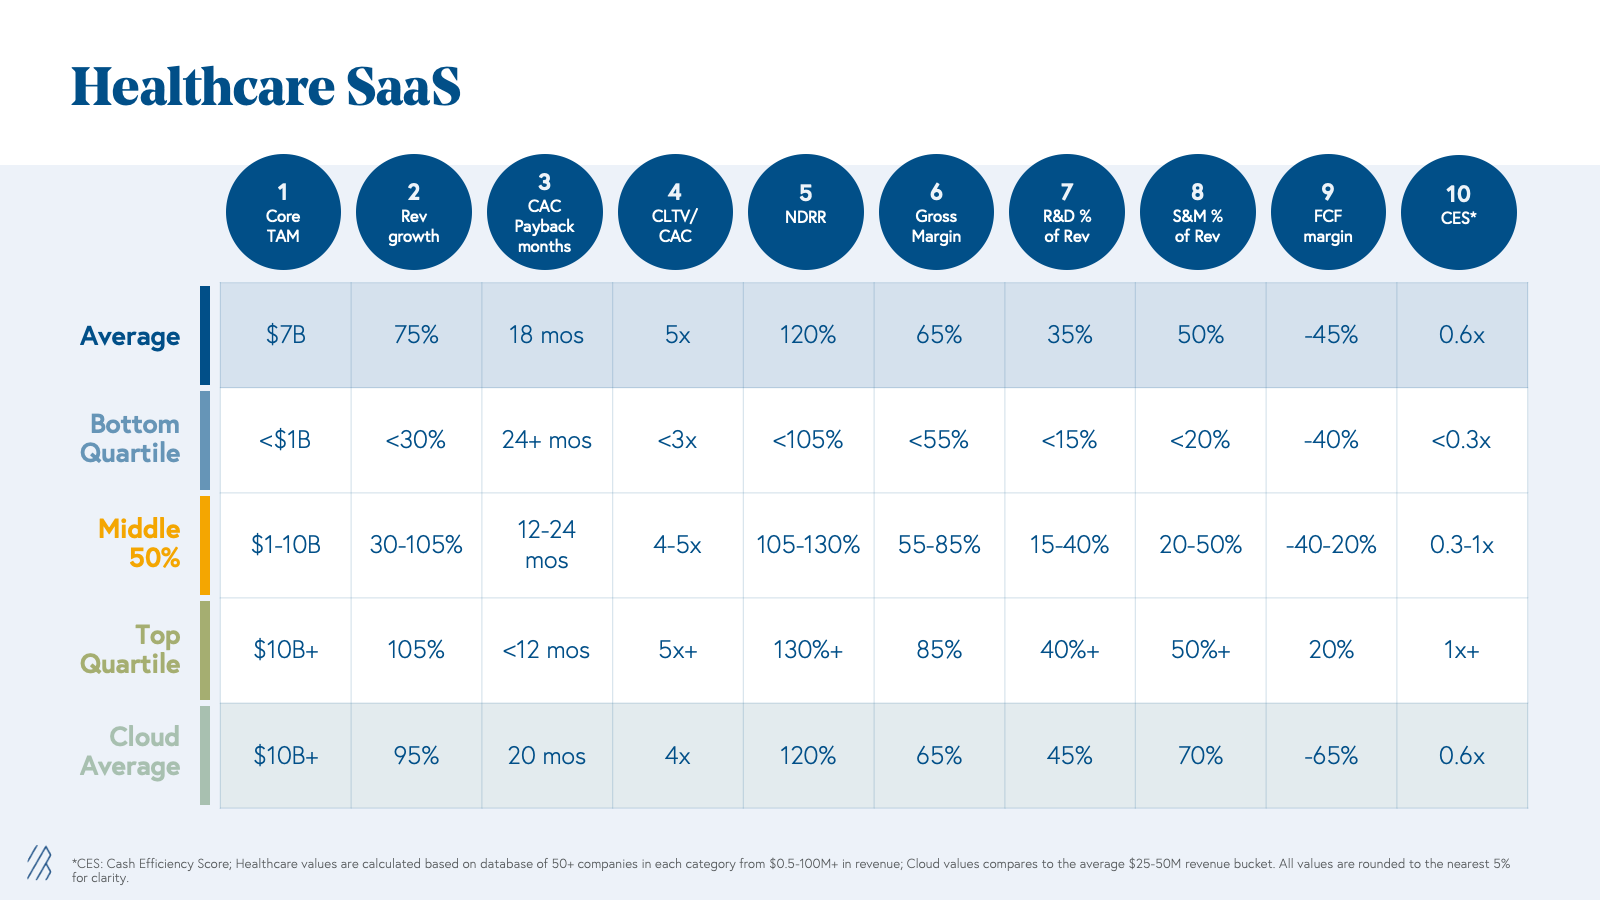
When comparing Healthcare SaaS to traditional Cloud company metrics, the average KPIs are very similar; however here are two critical insights for building healthcare SaaS ventures.
1. Market size and clear financial ROI matter
Similar to Cloud, Healthcare SaaS is a great business model with efficient and highly recurring revenues. However, adoption of software solutions in healthcare is low, as demonstrated by the overall breakdown of healthcare spend, which we estimate is only 10% of the $950 billion admin spend today. As a result, we have seen fewer healthcare SaaS companies achieve Centaur status ($100M+ ARR). As you can see from the benchmarks, average Healthcare SaaS companies have smaller total addressable markets (TAM) than the average Cloud counterparts given that they are operating in an industry vertical.
We encourage founders to find a wedge with a clear value proposition that supports a large enough TAM in order to build a category-defining company, as opposed to a one-point healthcare IT solution. It also requires a clear proof of financial ROI for the buyer where often a direct impact to revenue is preferred over reduction in costs. In addition, as companies hit $25M+ in revenue, like in any other vertical SaaS category, it’s valuable to identify what a second act would be to deliver more value. This can come from incremental applications, payment rails, and other indirect monetization features such as marketplaces.
2. Validate and match sales cycles by titrating sales and marketing spend
On average, we see healthcare SaaS companies growing 75% YoY compared to 95% YoY for Cloud businesses. This is largely due to smaller TAMs and fewer buyers in healthcare SaaS, contributing to what are often slower sales cycles and more enterprise-like go-to-market motions. Whether selling to hospitals, payers, employers, or pharma, it is widely known in the industry that sales can be sluggish given compliance requirements, bespoke integrations, and multiple stakeholders. Despite this, we see a similar CAC payback on a gross-margin adjusted basis likely driven by the lower spend in sales and marketing as a percent of revenue of 50% compared to 70% for cloud companies. We see that the best healthcare SaaS companies can titrate sales and marketing spend and employ a capital-efficient way to learn and validate sales motion and sales productivity. Use these learnings before ramping up a sales team as fewer end customers should mean fewer sales reps needed at scale. Ultimately, companies should strive to maintain efficient CAC paybacks below 20 months adjusted on a gross margin basis.
Insights on tech-enabled services
1. The sky’s the limit for growth
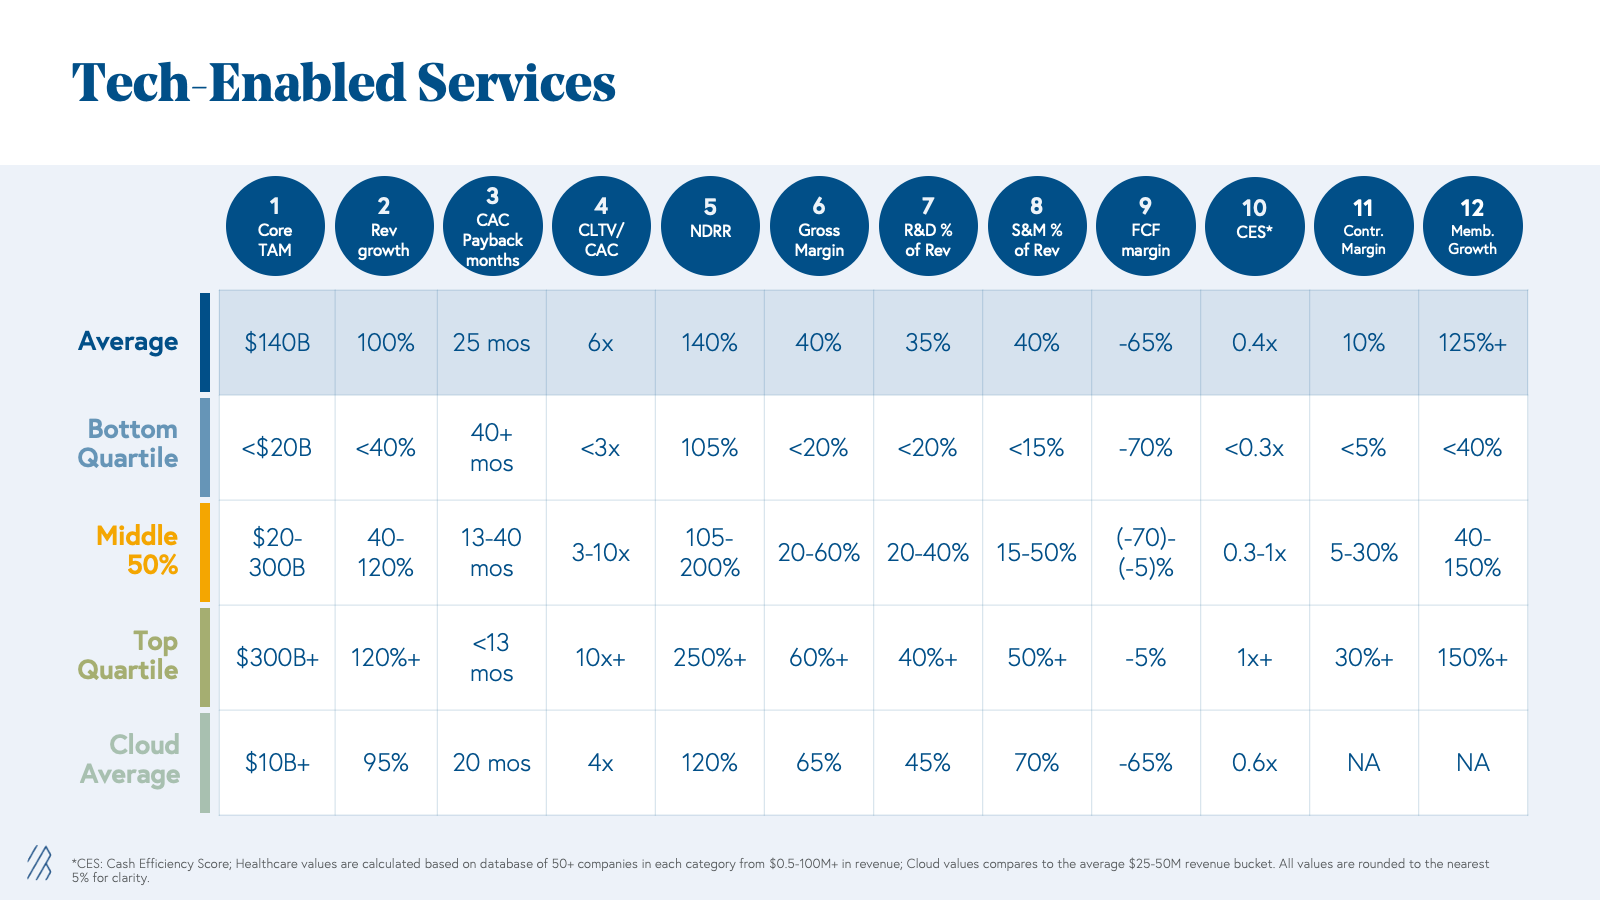
The market sizes for tech-enabled services are orders of magnitude larger than those of healthcare SaaS companies. While a healthcare SaaS or cloud business would have a TAM of $7-10 billion on average, tech-enabled service businesses have on average $100+ billion TAMs. Therefore, we see that on average tech-enabled services companies grow at ~100% year-over-year, which is faster even than the average cloud business while spending significantly less on sales and marketing (~30% less S&M as a percent of revenue than Cloud businesses).
For example, companies innovating in the kidney care space represent a $300 billion+ opportunity. This TAM is a top quartile or what we at Bessemer call a ‘best in class’ metric. (Kidney care spend is almost 1% of the entire US Federal Budget. Yes, you read that correctly, Federal—not just healthcare federal spend.) There are many specialty areas similar to kidney care that can be addressable with tech-enabled services including cardiology, MSK, maternal health, and oncology to name a few.
2. Delight your customers to expand your business
The majority of businesses we analyzed have a B2B2C go-to-market strategy. Similar to Healthcare SaaS, there are few payer and employer accounts to sell into, making the CAC payback an enterprise and mid-market-like motion. However, we have seen companies in the tech-enabled services category excel at expanding sales within a customer base, as shown in the high Net Dollar Revenue Retention (NDRR) metric of on average 140% year-over-year. NDRR is calculated as total revenue inclusive of expansion minus churn, which is contract expirations, member churn, cancellations, or downgrades. While revenue for tech-enabled services is transactional in nature, a strong NDRR is a strong indicator of the recurrent nature of top line revenue.
There are two drivers for account revenue expansion: (1) Net new patients reached and engaged within a given customer member population, and (2) increase in average revenue per user (ARPU). The first is impacted by an increase in incidence of disease or new patients diagnosed and engaged every year. Compared to SaaS which would often be compensated on a per/seat or enterprise contracts basis, tech-enabled services are compensated on a per member basis. Granted price points may be lower than software licenses, there are many more patients that can be engaged and thus a higher chance to increase the size of the contract and improve NDRR over time.
Increase in ARPU can be negotiated and ‘earned’, especially when the company demonstrates strong clinical outcomes and financial ROI on the clinical services. When we talk about ARPU, we refer to revenue per member in the form of fee-for-service payments, bundles, shared savings or capitation that ultimately align incentives across stakeholders, put the patient at the center and create value for the healthcare system. We also believe referenceable customers and proven outcomes will help tech-enabled services companies win business faster, thereby improving the scalability of the business model.
3. Gross profit is your North Star
It is no surprise that unit economics look drastically different for tech-enabled services and SaaS business models. However, this makes many onlookers scratch their heads as to how efficient these Tech-Enabled Services businesses can be and whether these companies should be venture-backed. Our answer is yes, they should be—given the high growth and highly recurring nature of top-line revenue, as well as the opportunity to drive unit economic improvement over time by leveraging technology to improve gross margins while creating value for patients and the system overall.
We have seen tech-enabled services companies make a steady progression from good (25% - bottom quartile) to best (60% - top quartile) to improve gross margins as they scale. There are several levers to improve gross margins and gross profit. Here’s the basic formula:
Gross profit = # of patients (volume) * Annual revenue per user (ARPU) - Cost of delivering service (COGS)
Technology will help you reduce COGS. However, the marginal cost of delivering care will vary by clinical model and condition acuity, among other reasons. We don’t expect all companies to leverage only light-touch-technology approaches but rather to leverage technology to enable clinicians and provide omnichannel experiences. Over time, companies can get better at managing the efficiency of their provider panels (i.e., increase the number of patients a provider can see over time) through better processes and technology, as well as by leveraging different types of providers operating at top of license (i.e., leverage health coaches, nurse practitioners). All of these levers can affect clinical quality and outcomes and thus require a delicate balance between technology deployment and robustness of clinical efficacy to improve how you deliver care. As discussed previously, strong financial and clinical ROI will help you negotiate ARPU over time.
The public playbook for health tech
As you build a health tech company, we bet that you hope it will go public one day. Whether we are making an early-stage Series A bet or a late-stage Series D investment, we partner with founders who have long-term visions. Building an enduring business and going the distance generally requires becoming a publicly-traded company. M&A outcomes will happen along the way as companies develop strategic positions in the market, and build scale faster, but we invest in teams that believe they can and will create the platforms that can thrive as standalone public companies.
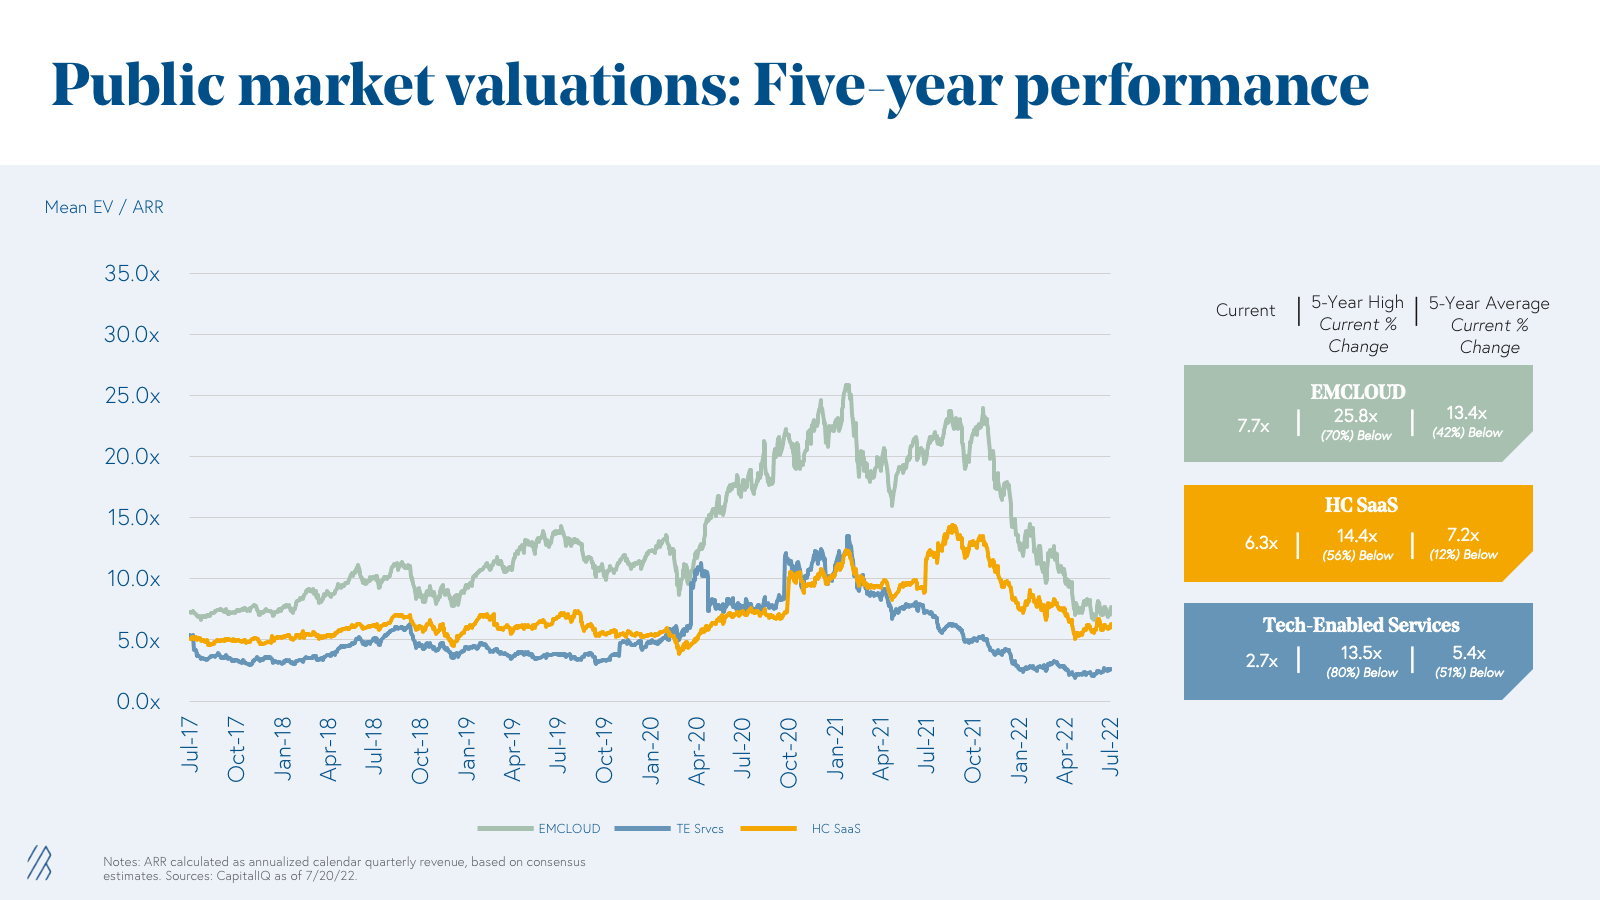
Catalyzed in part by the IPO and subsequent M&A of Livongo in 2019, digital health companies have made a recent debut in the public market. Though, it is important to note that Cloud, Healthcare SaaS, and Tech-Enabled Services have all experienced corrections in the public markets over the first quarters of 2022. We have seen EV/ARR multiples drop -80% for Tech-Enabled Services, -70% for Emerging Cloud Index (EMCLOUD) companies, and -56% for Healthcare SaaS. In the graph below, we see that multiples of tech-enabled services and healthcare SaaS businesses traded at roughly equal multiples for most of 2020 and 2021. Given the short lifespan of digital health companies in the public markets, and differences in unit economic profiles, many leaders continue to ask what is the right way to value these business models. While the digital health industry is still nascent, we wanted to offer our own view and approach to valuing fast-growing health tech businesses.
How to value Healthcare SaaS
Given the similarity between healthcare SaaS and cloud business KPIs, we believe ARR is the right metric to define enterprise value. A traditional EV / ARR can be used for fast growing healthcare SaaS businesses. The exact valuation multiples will range overtime but studying multiples over the last five years we see an average of 7.2x, median of 6.3x.
While twelve months ago there was a relatively stronger emphasis on top-line growth or ‘growth at all costs,’ we now see a stronger focus on profitability. Efficiency scores can help companies find the right balance between growth and profitability. Efficiency score is calculated as:
Efficiency score = ARR year-over-year growth rate + FCF margin of ARR
However, keep in mind, this is only applicable to companies in the $30 million+ ARR range, as before this milestone the revenue base is too small for the metric to be meaningful. Healthcare SaaS businesses should aim to achieve the “Rule of 40.” A metric that growth-stage and public investors use to indicate efficient growth, the Rule of 40 is when the combination of your growth rate and profit margin equal or exceed a 40% overall efficiency score. On average, Healthcare SaaS companies in our cohort have an efficiency score of 35% compared to companies in EMCLOUD with 50% scores.
How to value Tech-Enabled Services
Over the last two years, public tech-enabled services companies have been valued like software businesses on EV/ Revenue multiples. In July 2021, we saw a strong correlation between EV/Rev Run Rate multiples and forward year expected growth with an R² of 0.79, where numbers closer to 1 indicate a stronger correlation. As of July 2022, this is no longer the case with an R² of 0.001 and a negative sloped trend line.
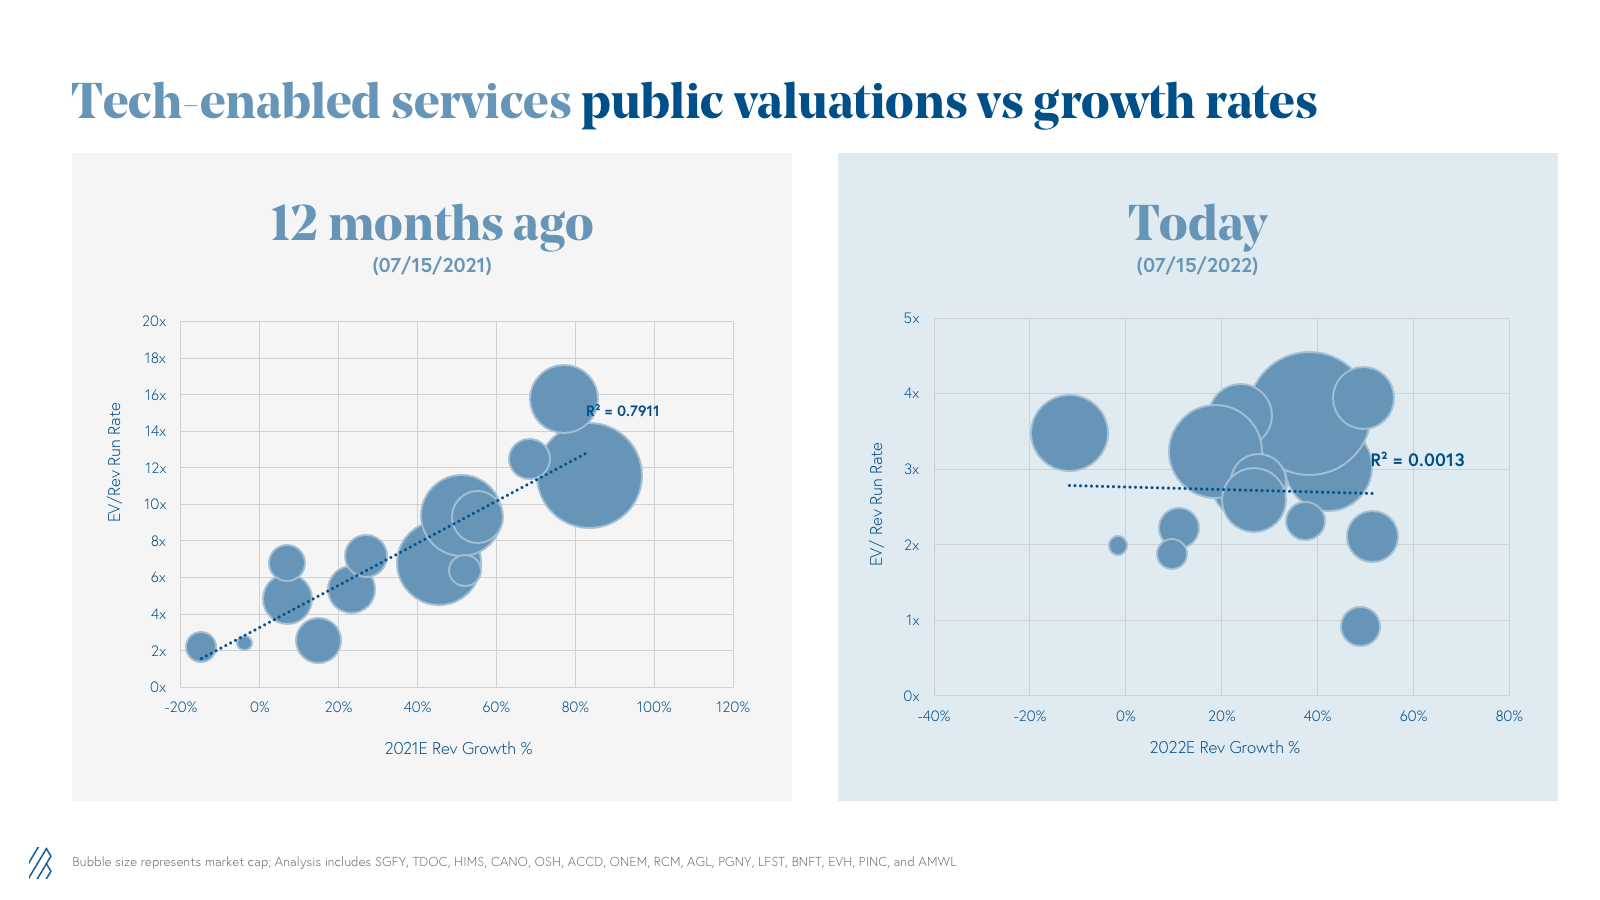
Given the unit economic profile of tech-enabled services, we don’t think these businesses should be valued on top-line revenue only. The public market meltdown of the last 12 months has impacted unprofitable companies much more than those who are EBITDA profitable (avg. EV/ Rev Run Rate multiple for profitable tech-enabled services companies is ~3x versus ~1.5x for unprofitable ones as of July 2022 compared to ~7.5x for both profitable and unprofitable tech-enabled companies back in July 2021).
In the private equity world, healthcare services businesses are valued on EBITDA. However, at the later stages, these are relatively low growth businesses (<30% year-over-year growth). At Bessemer, we are looking to invest in high-growth with highly recurring revenue, which we acknowledge requires investments in operating expenses to grow exponentially and achieve improvements in gross margins from technology deployment. Thus, we believe that Gross Profit is a more relevant metric for tech-enabled services businesses. By looking at multiples on an EV/ Gross Profit basis we can value growth while also encouraging gross margin improvement over time.
Let’s bring this idea to life with a few examples:
Imagine there are two companies:
- Company #1: A cloud SaaS business with $100 million ARR growing at 60% YoY, 70% Gross Margins
- Company #2: A tech-enabled healthcare services business with $225 million revenue run-rate, growing at 60% year-over-year but with 45% gross margins.
A year ago, both companies would have been valued at 14x EV/ Revenue run rate.
- Company #1: $100 million * 14x = $1.4 billion
- Company #2: at $225 million * 14x = $3.15 billion
Instead, we suggest making adjustments to how tech-enabled services companies are valued, adjusting to gross profit. In this case, take the 14x multiple 45% gross margin and the adjusted new revenue multiple is ~6x. (Or $225 million 6x = $1.35 billion) Which is similar to applying the 14x as a EV/ Gross Profit multiple.
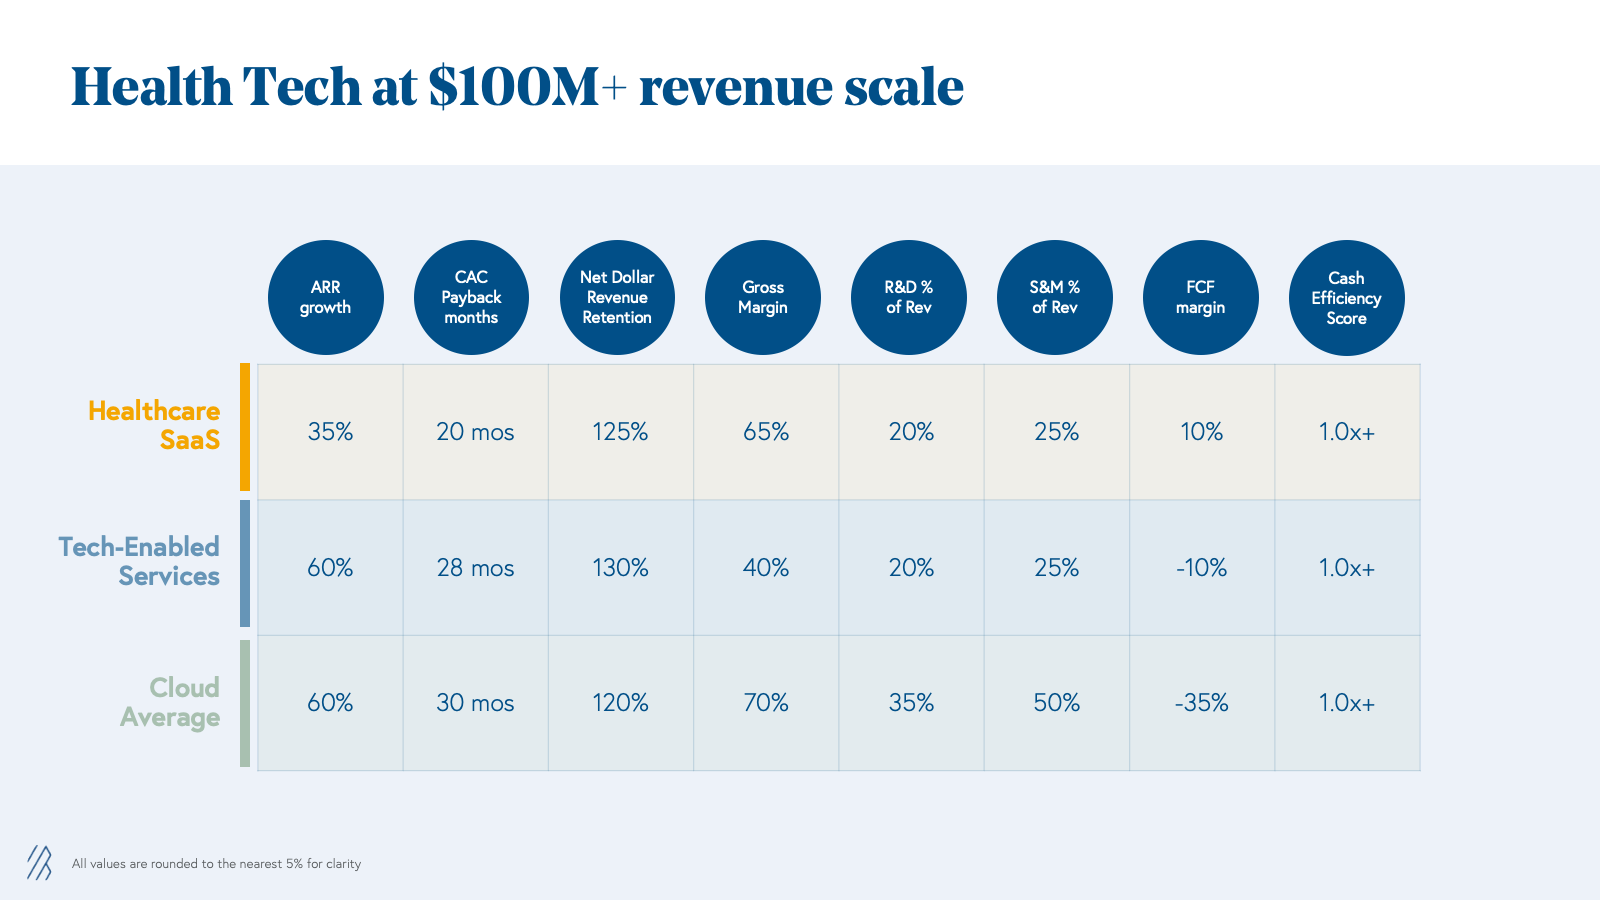
Each of the hypothetical companies above is a representative financial profile of the average for each category for companies at $100 million+ scale. While it requires patience and at the earlier stages these companies are less efficient, our analysis shows that there are really interesting businesses that can be built in both Healthcare SaaS and Tech-Enabled Services categories at scale. As you can see below, Tech-Enabled Services can continue to grow just as fast as Cloud businesses and on average have higher FCF margins and much larger TAMs.
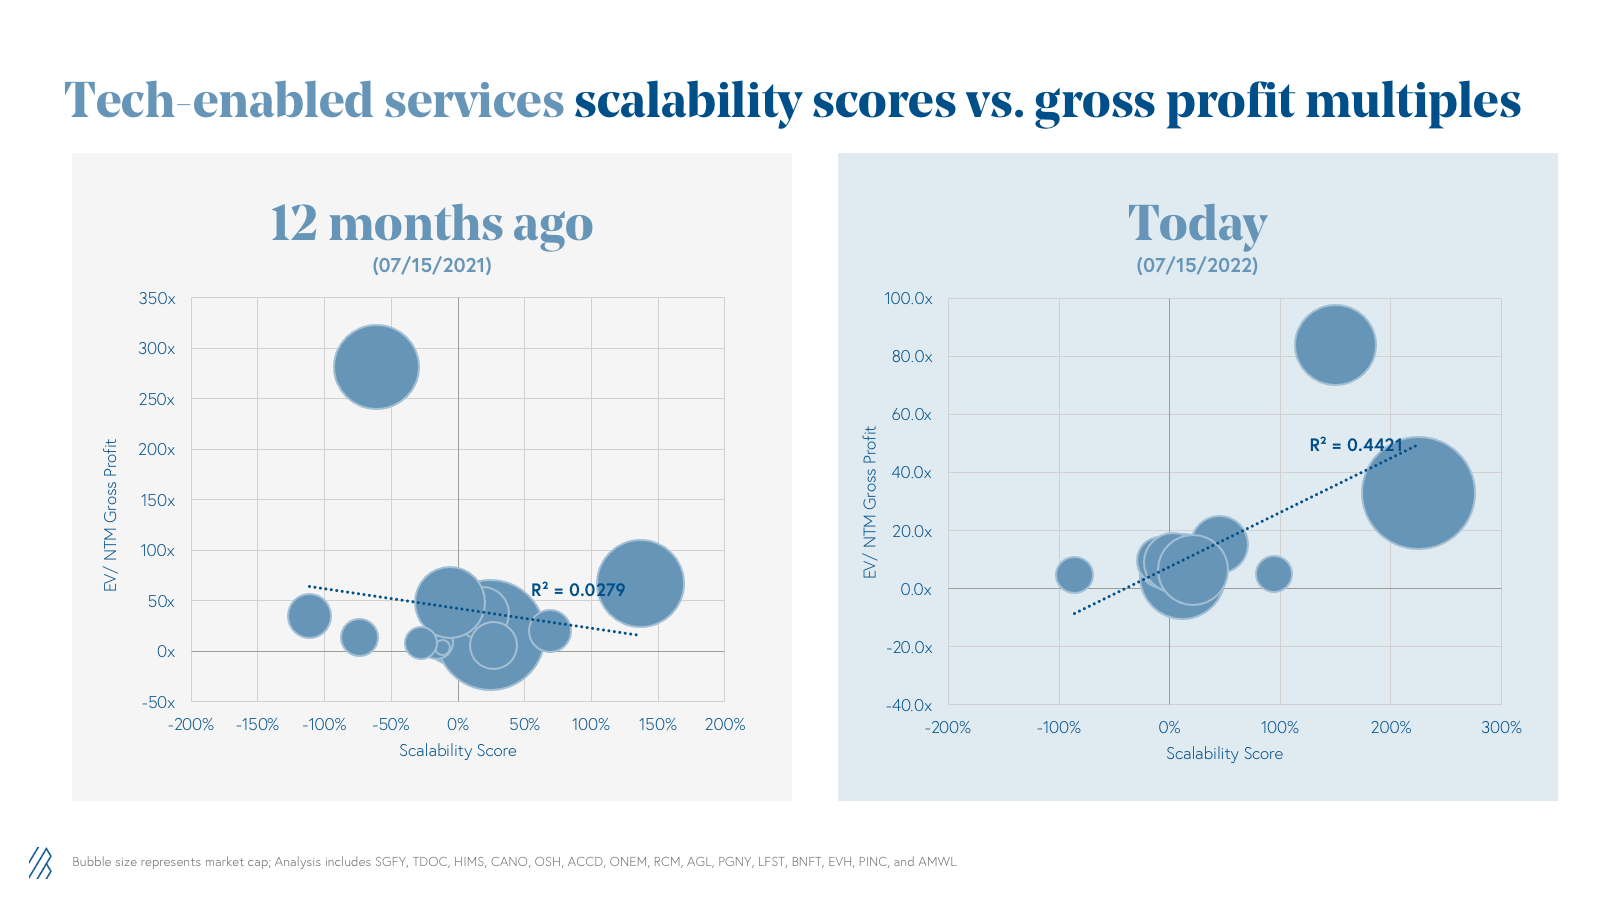
Similarly to SaaS businesses, efficient growth at scale should be rewarded for tech-enabled services that have highly-recurring top-line revenue. So for Tech-Enabled Services, we propose to track a new metric: Scalability Score. Similar to the Efficiency Score, Scalability is calculated as:
Scalability score = FCF margin + gross profit year-over-year growth rate.
Scalability is only applicable to companies in the $25 million+ ARR range, as before this milestone the revenue base is too small for the metric to be meaningful and the “Rule of 40” should also apply. As of July 2022, we see tech-enabled services companies in our cohort have a 32% score on average. While there was no correlation to scalability back in July 2021, we see an R²=0.44 in July 2022.
Final thoughts—for now
As the public markets are revisiting how they value healthcare investments, especially in tech-enabled services, this new perspective is making its way down to private markets (even for companies at the earliest stages).
At Bessemer, we have always believed that building in healthcare is not for the faint of heart and it's important to be armed with the best information to grow efficiently. If you are about to raise your next round of financing as a venture-backed healthcare startup, we encourage you to show us how your startup compares to these benchmarks or include them in your next boardroom discussion as you track your business’ growth.
In this first iteration of our work, we analyze the reality of building healthcare tech businesses by looking at Good-Better-Best KPIs for each business model. Over the course of the next six months, as we grow the number of companies included in the database to 100+ businesses, we plan to publish new studies on how healthcare SaaS businesses sell to payers, providers, and pharma, as well as case studies on building value-based care vs. care delivery B2B2C vs. direct-to-consumer (D2C) businesses. Most importantly, we will produce a full report on scaling healthcare ventures with all our financial and operational benchmarks for companies at different stages of growth (from $0-10M, $10-50M, $50-100M and $100M+ revenue), similar to our colleagues’ Scaling to $100M work. To be the first to receive these reports in your inbox, join Atlas by going to bvp.com/subscribe.
If you have feedback or want to show us your metrics please reach out to Sofia Guerra at sguerra@bvp.com and Steve Kraus at steve@bvp.com. We are looking forward to hearing from you!
Methodology
We started by studying 52 companies: 23 in healthcare SaaS and 29 in tech-enabled services. We compiled financial and operational metrics since inception to current revenue run-rate to study how each of the businesses have scaled over time. In total, we have analyzed over 250 years’ worth of company data and thousands of individual data points. Over the coming months, we plan to expand this database significantly to over 100+ businesses and publish deeper dives into each business model.
Acknowledgements
We would like to thank Janie McDonough and Stephanie Donahue for helping build the Healthcare database and Andrew Hedin, Morgan Cheatham and the Bessemer growth and cloud teams for their advice and input on this analysis.


